FINANCIAL HIGHLIGHTS
| FY3/2022 | FY3/2023 | FY3/2024 | FY3/2025 | FY3/2026 | |
|---|---|---|---|---|---|
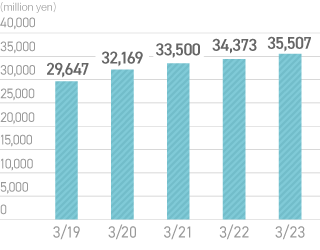
| Net sales (million yen) | FY3/202234,373 | FY3/202335,507 | FY3/202437,856 | FY3/202541,147 | FY3/202643,435 |
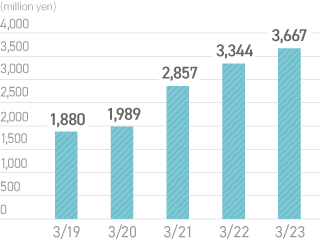
| Operating income (million yen) | FY3/20223,344 | FY3/20233,667 | FY3/20244,584 | FY3/20255,809 | FY3/20266,533 |
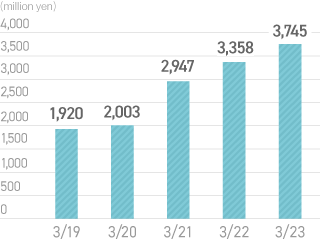
| Ordinary income (million yen) | FY3/20223,358 | FY3/20233,745 | FY3/20244,523 | FY3/20255,858 | FY3/20266,617 |
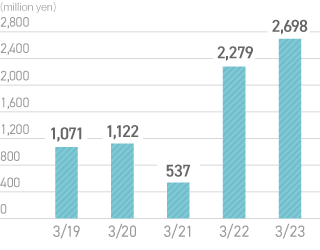
| Net income attributable to owners of parent (million yen) |
FY3/20222,279 | FY3/20232,698 | FY3/20242,929 | FY3/20253,920 | FY3/20264,284 |
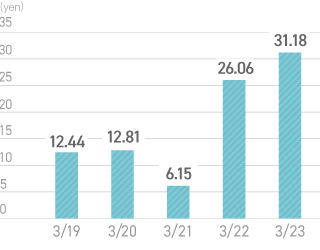
| Net income per share (yen) | FY3/202226.06 | FY3/202331.18 | FY3/202434.38 | FY3/202545.91 | FY3/202650.07 |
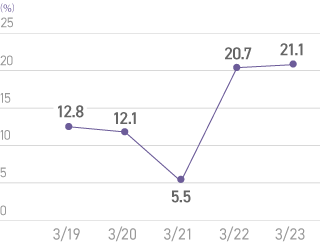
| ROE (%) | FY3/202220.7 | FY3/202321.1 | FY3/202419.7 | FY3/202522.0 | FY3/202620.2 |
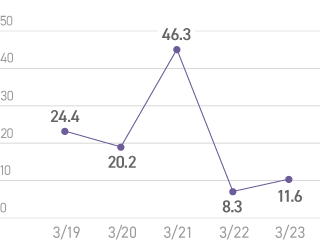
| P/E Ratio | FY3/20228.3 | FY3/202311.6 | FY3/202416.4 | FY3/202514.8 | FY3/202613.4 |
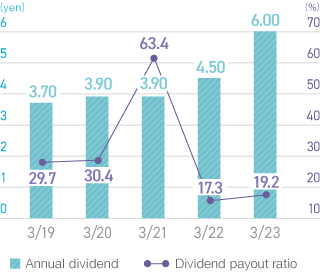
| Annual dividend (yen) | FY3/20224.5 | FY3/20236.0 | FY3/20248.0 | FY3/202512.0 | FY3/202612.5 |
| Dividend payout ratio (%) | FY3/202217.3 | FY3/202319.2 | FY3/202423.3 | FY3/202526.1 | FY3/202625.0 |
